Design Research · 01 / 08
The Work OS Landscape
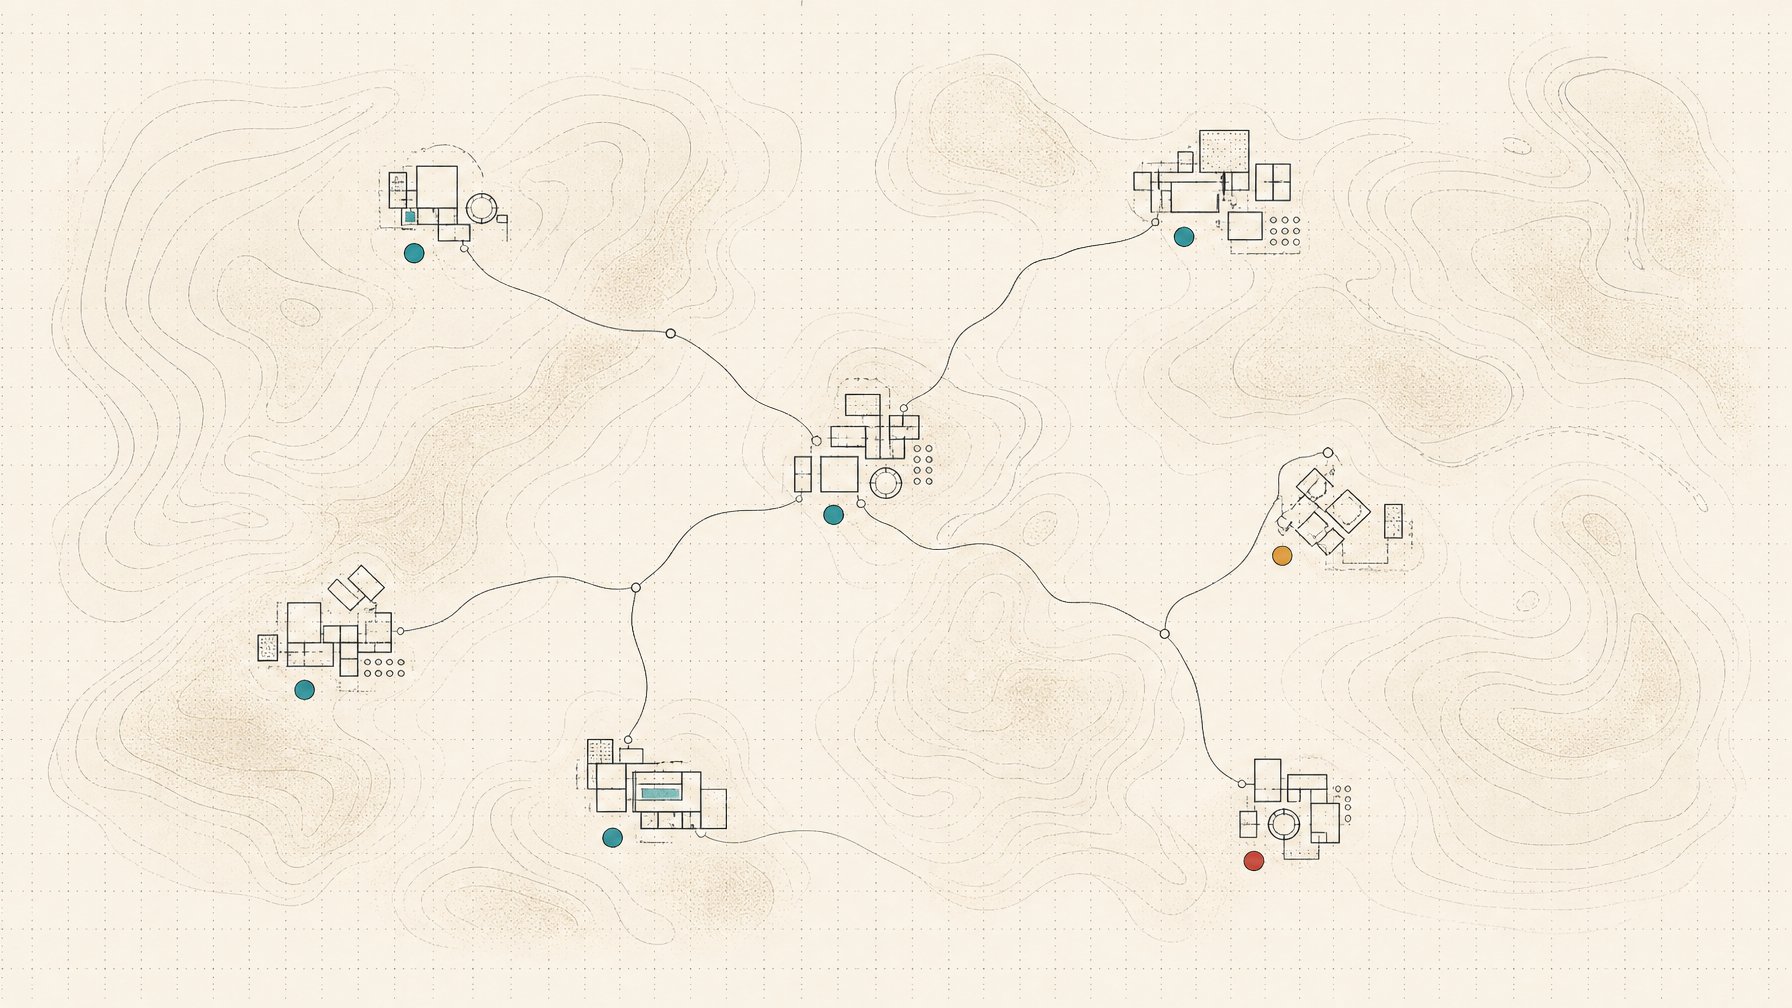
How the field answers "how is everything going?" — and where Collaboration OS (Iris Field) can stand apart. The headline finding: the consensus best practice is a human-written status plus a single categorical health signal, not a computed number — and genuinely spatial portfolio views are the whitest space in the category.
The Canonical Players and Their Visual Signatures
Monday.com owns the "color as data" school — saturated status pills (green Done / orange Working / red Stuck), progress bars, timeline bars. You glance and feel status before reading it. The cost: color-saturation doesn't scale to portfolio level. Color is great for one board, noisy across fifty.
Asana Portfolios is the most mature answer to the portfolio problem and the closest mainstream reference. Each project row rolls up a human-set status color (On track / At risk / Off track / On hold), an auto progress %, owner, due date. Two views matter: the Progress tab (status roll-up + update history) and Portfolio Workload (a per-person capacity heatmap, over-capacity flagged red).
ClickUp is the maximalist: the "Everything" view, widget-grid Dashboards as a "command center." Powerful — and the poster child for configuration fatigue: endless toggles, weeks-long learning curve, the dashboard you build and never open. (Worth remembering: this is our system of record. Collaboration OS exists because of this critique.)
Notion — one dataset renders as table, board, calendar, timeline, or gallery. The gallery view is what agencies reach for to present clients as visual objects — logos/covers as card previews make a client roster feel like a wall, not a spreadsheet.
Airtable Interfaces — a builder layer turning a base into a curated dashboard so viewers see a designed surface, not raw rows. This is essentially the view-model idea, productized — the closest existing analog to our engine.
Productive.io / Scoro / Teamwork — the agency-ops tier: portfolio views where each engagement shows budget burn, margin, utilization. We excluded financials from the Airtable migration, but this is the genre if that ever changes.
The Design-Forward Generation
Linear is the strongest single reference for calm + legible. Its overview magic is the project update: a human writes a short status and picks a traffic light (On track / At risk / Off track; gray = no update yet). The initiatives list becomes a column of colored health dots scannable in one second — human judgment, not an auto-computed %. Each project also has a progress graph (scope line vs completed curve — rising with activity, flattening when stalled). The aesthetic is restraint: monochrome, dense, keyboard-fast, one accent color.
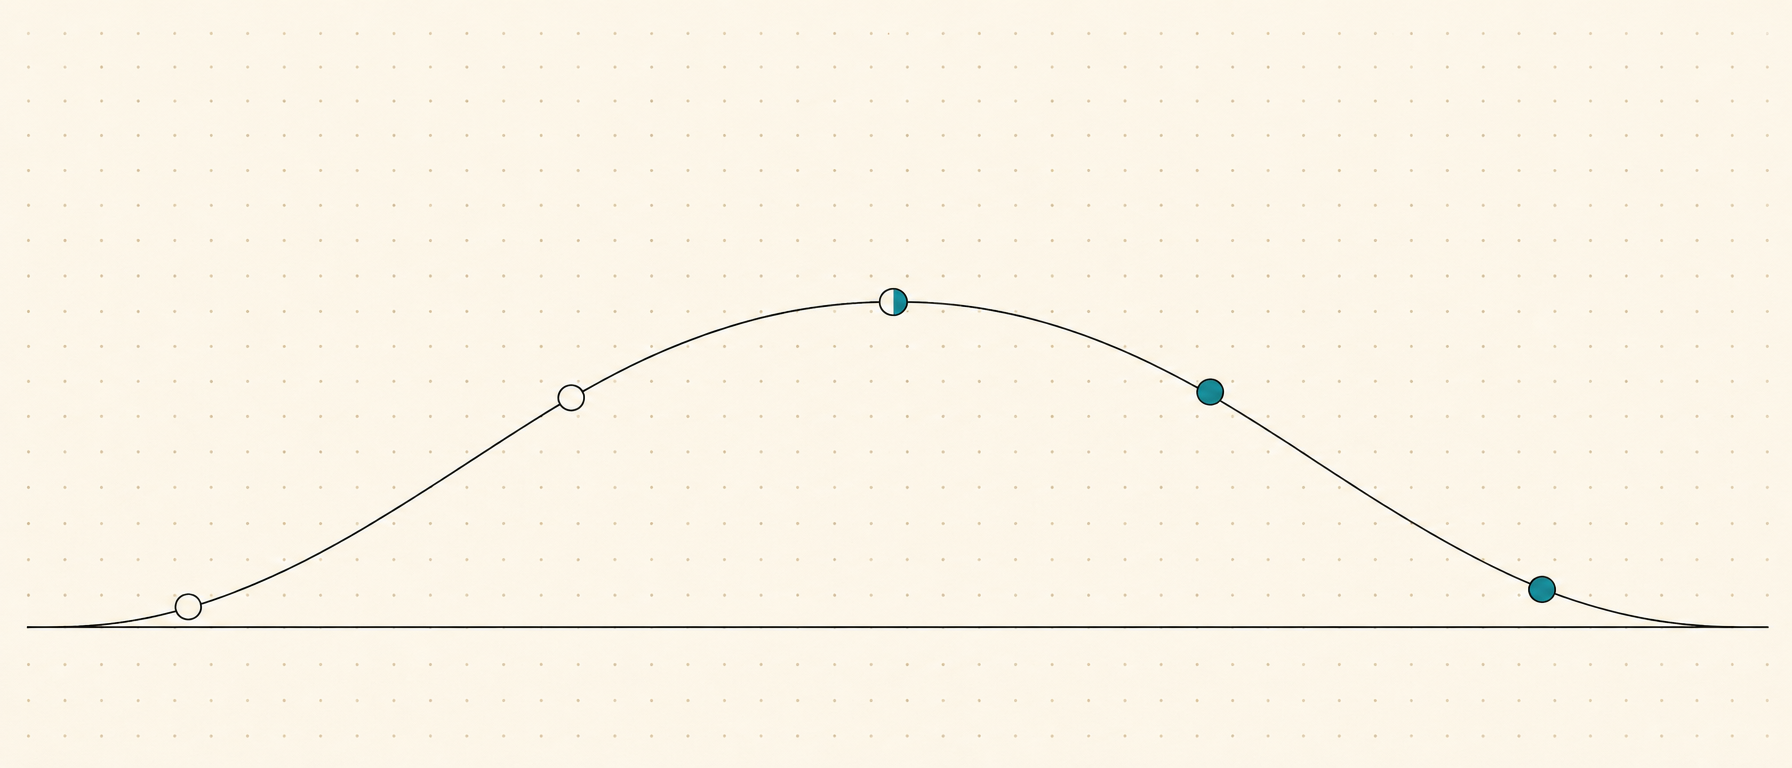
Basecamp — "one page per project," six fixed tools, no configuration. Its novel device is the Hill Chart: each work-stream is a dot on a bell curve — uphill = still figuring it out, downhill = just executing. Someone drags the dot by hand; the position is felt judgment, snapshotted to history. It answers a question progress bars can't: is this risky, or just unfinished? A genuinely different progress primitive worth stealing.
Height — the cautionary tale. Pivoted to "autonomous, AI-first" project management in late 2024, announced sunset March 2025, shut down September 2025. An AI-first PM tool with no calm, human-legible surface didn't find a market.
Things / Todoist — the calm-productivity bar for typography, motion, restraint. The reference for feel, not portfolio.
The Progress-Signal Vocabulary (weakest → richest)
- Auto progress bars / % — cheap; "80% of tasks done" hides risk
- Human status + traffic light (Linear, Asana) — current best practice: two sentences and a color; legible, honest, low-effort
- Burn-up / scope graph (Linear) — shows scope creep and velocity over time
- Hill chart (Basecamp) — uniquely encodes uncertainty, not just completion
- Workload heatmap — capacity by person
- Portfolio timeline/Gantt — "what's due when" swimlanes
What Agencies Actually Do
Two camps: the ops-heavy camp (Productive/Scoro, or bespoke Notion/Airtable "Agency OS" builds — client DB + pipeline + tracker + gallery portal) and the visual/craft camp (Milanote, Figma, Notion galleries). The recurring theme: agencies distrust generic Work OS chrome and build a presentation layer over their data — which is exactly the Collaboration OS thesis, validated in the wild.
The Critique — Opinionated Simple Views Win
The dominant complaint about ClickUp/Monday is configuration fatigue and "the dashboard nobody looks at" — reports built once and abandoned. The counter-movement (Linear, Basecamp, Things) is opinionated defaults over configuration: fewer views, chosen well; human status over auto-metrics. For a calm tool, the strategic move is subtraction — one strong overview, not a widget buffet.
The Gap: Spatial Portfolio
Almost nobody does a genuinely spatial portfolio. Infinite canvases (Miro, FigJam, Milanote, Obsidian Canvas) are manual boards, not live data. Heptabase/Kosmik are spatial but for notes. Dependency graphs exist only within projects. The unoccupied position: clients and engagements as spatial objects on a live field, positioned by meaning (relationship, momentum, risk), each carrying a Linear-style human health signal — portfolio as territory rather than list. No incumbent combines live synced data + spatial layout + calm human-set status. (Deeper dive: Spatial Interfaces for Work.)
Takeaways for Collaboration OS
- Center a human-written status + single health color per engagement (Linear's project update) — this fits "color reserved for status and time" perfectly
- Consider the hill chart as a second axis: uncertainty, not just completion
- Render clients as visual objects (gallery/spatial cards with the migrated logos), not rows — see Representing Clients Visually
- Treat view models as Airtable-Interface-style curated surfaces — the format already supports this
- Win on subtraction: one calm territory-map overview, not a widget buffet
Related
- Collaboration OS Design Research — hub
- Representing Clients Visually · The Client Dashboard · Spatial Interfaces for Work
- Collaboration OS Through the Pattern Language