Design Research · 08a · The Atlassian Question
The Teamwork Graph
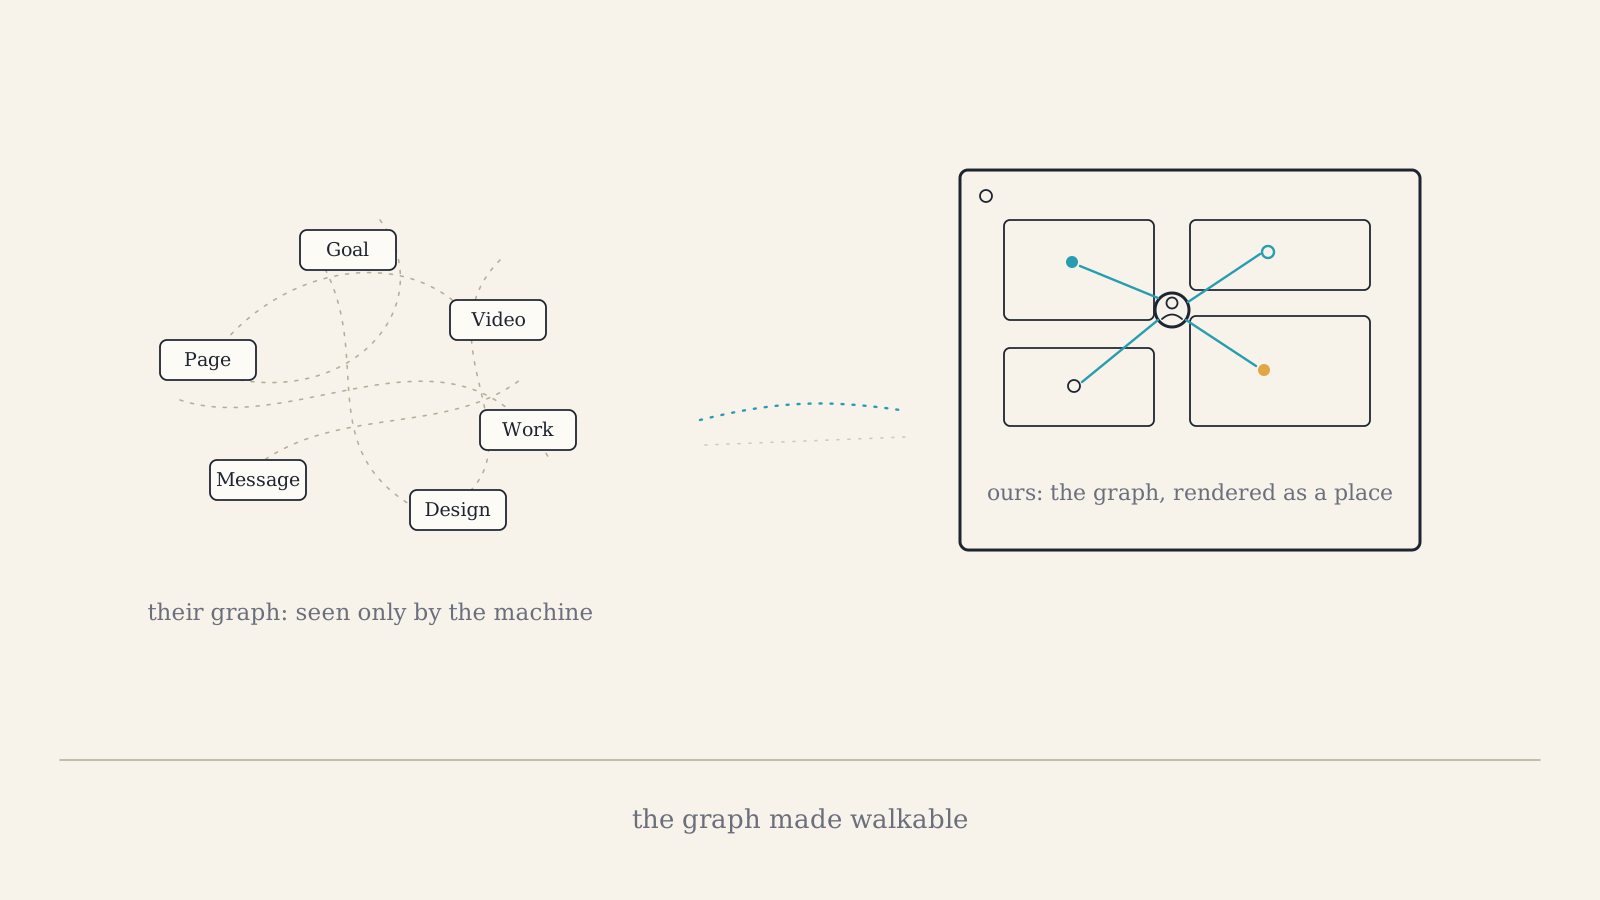
Atlassian's marketing for the Teamwork Graph shows a lovely constellation: people, pages, videos, and designs floating in space, joined by dotted lines. The picture promises a place you could walk around in. The product delivers something else entirely, and the gap between the picture and the product is one of the most useful things we've found in this whole survey. This is the first of two deeper dives following The Atlassian Question.
What It Is for Atlassian
The Teamwork Graph is Atlassian's "data intelligence layer": a unified model that connects work items, projects, pages, service requests, goals, ideas, and people across Jira, Confluence, Loom, and roughly a hundred third-party connectors. In their words, it "intelligently maps data to learn who you are, what you do, and how you do it." It exists to solve a real problem, the one they quantify as workers averaging eleven apps a day: context is scattered, and every app boundary loses some of it.
Who consumes the graph? Rovo agents, search, and cross-app enrichment. Not people. The graph is backend infrastructure, never directly visible or navigable to users. It makes AI answers better and search results smarter, and it surfaces related items inside existing screens. It is genuinely good plumbing.
The Tell: The Graph Is Invisible
Here is the tell. The graphic sells a place; the product ships a database. Nobody at Atlassian decided to let humans see the constellation, and that decision was probably correct for them: a general-purpose graph of everything in a large organization is a hairball. Force-directed graph views are the graveyard of knowledge tools; every wiki and note-taking app has shipped one, and they are admired for a day and never opened again, because an unorganized picture of everything is a picture of nothing. A horizontal vendor cannot commit to a layout, because layout is opinion, and their business is having none.
So the honest reading is: the Teamwork Graph makes their AI smarter while their humans keep looking at lists. The constellation in the ad is a picture of what the machine sees, shown to people who will never see it.
Their graph is what the machine sees. Our field is the same graph, given to the people.
What the Pictures Teach Anyway
And yet the graphics are worth studying, because they sketch what becomes possible once the graph exists. Two things stand out in Atlassian's own illustrations:
- Typed nodes. Not generic dots but kinds of things: idea, goal, request, release, knowledge, incident, customer, team. A graph you can reason about needs a vocabulary of node types, and theirs is a decent starter list.
- Typed relationships. The lines mean something: this person made that design, this goal contains that work, this request came from that customer. Edges with meaning are what turn a pile of records into a model of the practice.
Now the part that changes the mood of this note: Collaboration OS already has a teamwork graph. The mirror holds people, clients, engagements, tasks, meetings, artifacts, decisions, asks, and the moments inside recordings, all typed, all joined. Ours is small and curated where theirs is vast and automatic, and that is precisely why ours can do the thing theirs can't: be shown. The field is the graph rendered as a place, and a view model is a deliberate, opinionated answer to the question their product refuses: how should this subgraph be laid out today? (See Spatial Interfaces for Work for why user-stable layout, not physics simulation, is what makes spatial memory work.)
The practical to-do the pictures leave us with is vocabulary: keep growing the set of node types the field can hold (decisions, asks, and moments joined the graph this month) and keep every edge meaningful enough that an agent, or a person, can follow it and learn something true.
Moving Beyond: The Person Is the Node
The deepest difference is not visibility. It is what sits at the center of the model.
Atlassian's graph is tenant-bound. It models an organization's stuff, and people appear as members of the org: attributes of a company account, born when they're provisioned, gone when they're offboarded. That mirrors their customer, and it quietly imports an assumption: that work happens inside one organization at a time.
Our reality is different, and it is not a defect to route around; it is the design brief. Iris is not a traditional studio and does not work with traditional clients. The line between "client" and "team member" blurs constantly, and some future projects won't have a "client" at all. What we are actually coordinating is dynamic teams made up of agentic individuals: humans with full agency, who may or may not belong to some other organization, assembling around a piece of work for as long as the work wants them.
That reframe rewrites the graph's grammar:
- The person is a first-class, persistent node, not an attribute of any org. People outlive projects, carry reputation and craft between them, and can stand in several constellations at once.
- "Client" and "team" are roles on a relationship, not kinds of person. The same human can be a client in one engagement and a collaborator in the next, and the graph should hold that without contortion. In practice this means role lives on the edge (this person, in this engagement, holds this role) rather than on the node.
- Teams are constellations, not boxes. An engagement gathers whoever it needs; the org chart, where one exists at all, is just one more piece of context.
- Cross-pollination is a graph property. Projects learn from each other through shared people and shared patterns. When the person is the stable node, the paths between projects already exist; a tenant-bound graph has to fake them.
The schema is already leaning this way: people are global rows joined to clients and engagements through membership tables, not owned by them. The work ahead is to keep the promise as views and permissions grow, so that Published, Not Leaked becomes per-relationship rather than per-account-type: what you see follows from your relationships to the work, not from which side of a client/team wall you were filed on.
| Atlassian Teamwork Graph | Collaboration OS field | |
|---|---|---|
| Scope | One organization's tenant | A web of relationships around shared work |
| Center | The org; people as members | The person; orgs as context |
| Visibility | Backend only; consumed by AI | The product itself; the graph rendered as a place |
| Layout | None; layout is opinion, and they abstain | View models; arrangement as meaning, saved and shared |
| Growth | Automatic ingestion from ~100 connectors | Curated ingestion with context: planned meetings, typed artifacts, decisions |
| Who it serves | Smarter answers inside existing screens | Humans and agents aligning on one shared picture |
Related Notes
- The Atlassian Question — the parent note: a syllabus, not a stack
- A System of Work — the companion dive: practices over blueprints
- Spatial Interfaces for Work — why stable, authored layout beats force-directed physics
- Representing Clients Visually — the client as a place you re-enter
Sources
- Atlassian Teamwork Graph — "the data intelligence layer"
- Atlassian Rovo — the graph's primary consumer